
Earthquake Plotting CLI App
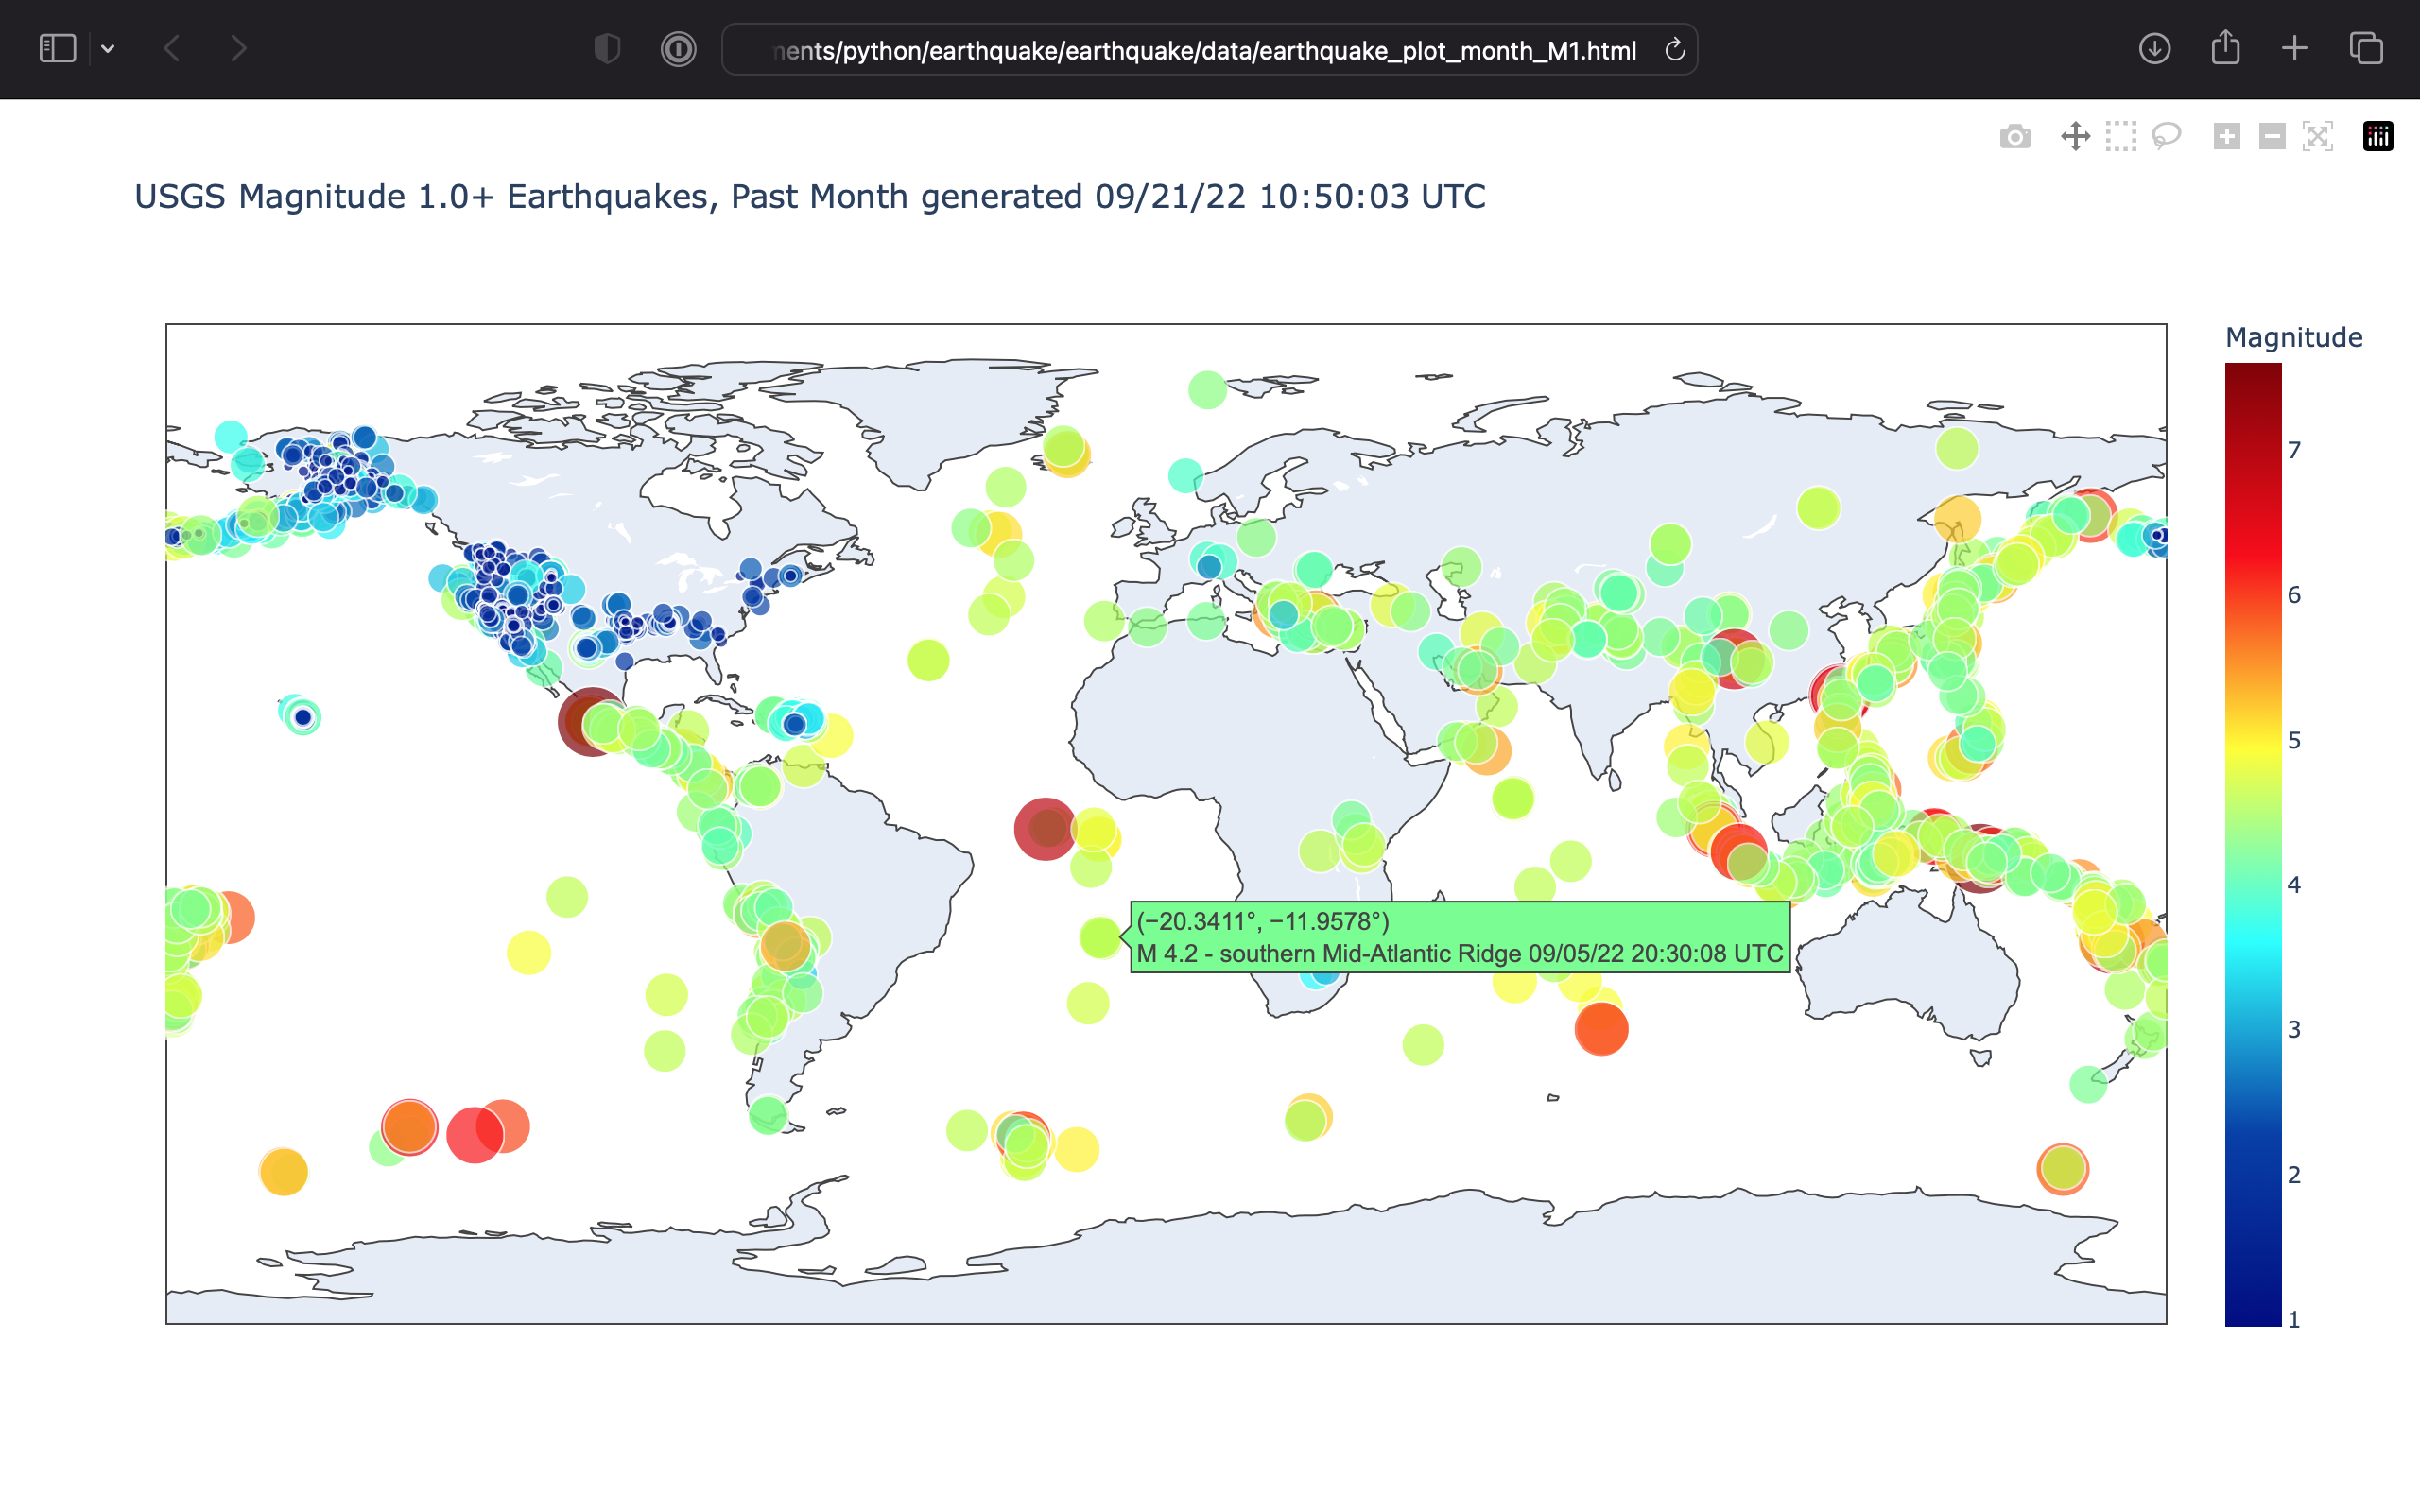
In my self-taught Python journey, I followed a project that used downloaded data of earthquakes from USGS (see book listed below). It created an HTML file that rendered an interactive plot with the magnitude of the earthquake on the map.
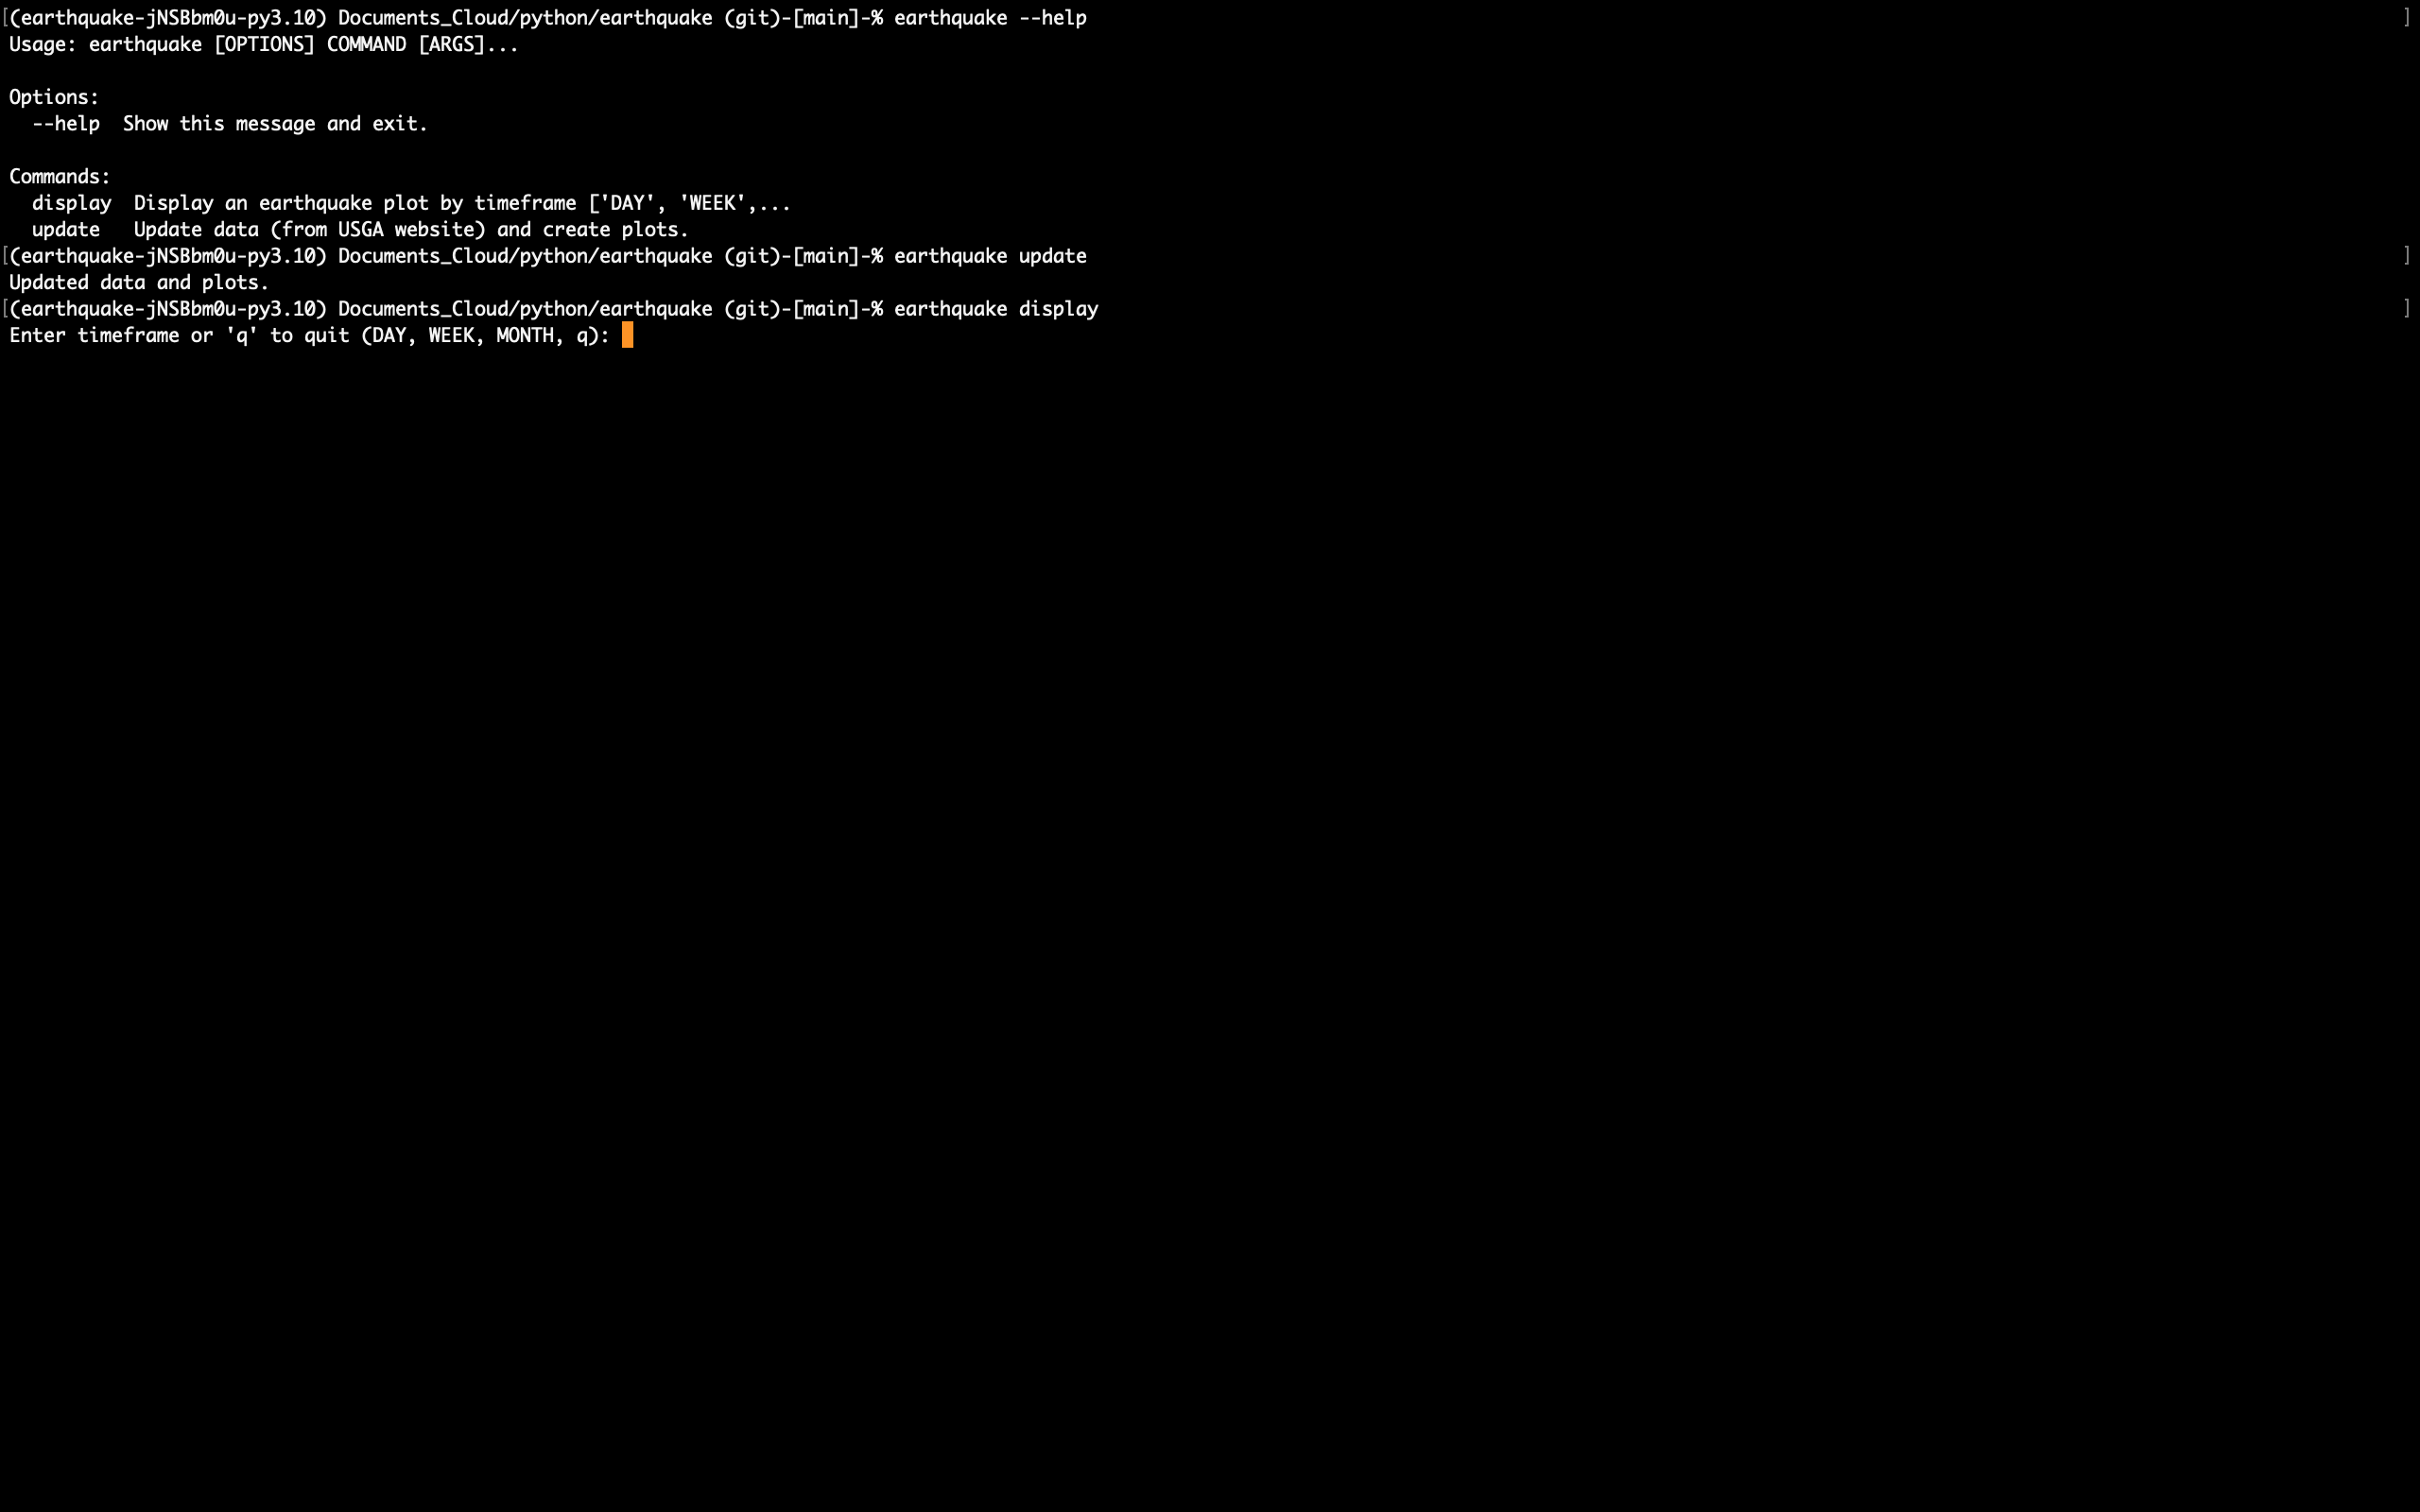
I wanted to build an app that would fetch the data from USGA and display the plot in a GUI interface. I could not get the interactive plot to work properly in the GUI. I eventually decided to build a CLI version that would fetch the data and display the plot in the default browser with the interactive abilities.
Coding Reflections
- This project was inspired from a project in Python Crash Course, 2nd Edition by Eric Matthes.
- Implemented fetching of data from USGA site (original project had static files for data).
- Attempted to implement as a GUI but was unable to get plots to render properly with interactive abilities.
- Created a CLI interface using the default browser for displaying the plots.
- Implementing this with a MVC design will allow a future upgrade to a GUI based design.
Source Code
See source code at the repo on GitHub.